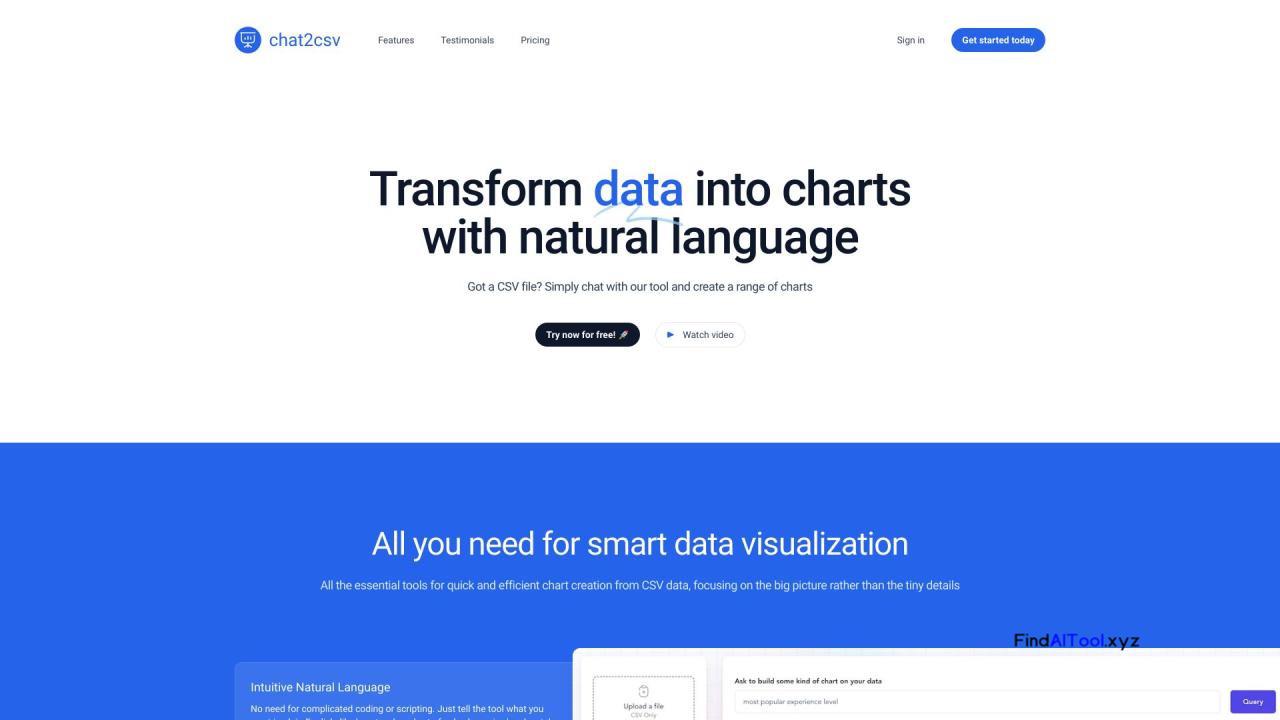
Chat2CSV is a powerful data visualization tool that transforms CSV files into compelling charts using natural language commands. This intuitive platform allows users to create various chart types without any coding or scripting knowledge, making data visualization accessible to everyone.
The software’s core features include an AI-powered interface that understands plain English instructions, suggesting optimal chart types for your data. Users can choose from a wide variety of visualizations, including pie charts, scatter plots, line graphs, and bar charts. Chat2CSV prioritizes data security and privacy by processing only necessary metadata while keeping the actual data on the user’s side.
To use Chat2CSV, simply upload a CSV file with headers and chat with the tool using natural language. For example, you can instruct it to “create a bar chart of sales by region,” and the AI will generate the desired chart instantly.
This tool is ideal for data analysts, business professionals, researchers, and anyone who needs to quickly visualize data from CSV files. It’s particularly useful for those who want to generate visual insights from raw data without the complexity of traditional data visualization software.
Chat2CSV streamlines the data visualization process, allowing users to focus on extracting insights rather than grappling with technical details. By simplifying chart creation and offering smart AI support, it enhances data analysis capabilities and helps users make data-driven decisions more efficiently. The platform’s user-friendly approach and focus on data security make it a valuable asset for both individuals and organizations looking to improve their data visualization workflows.

