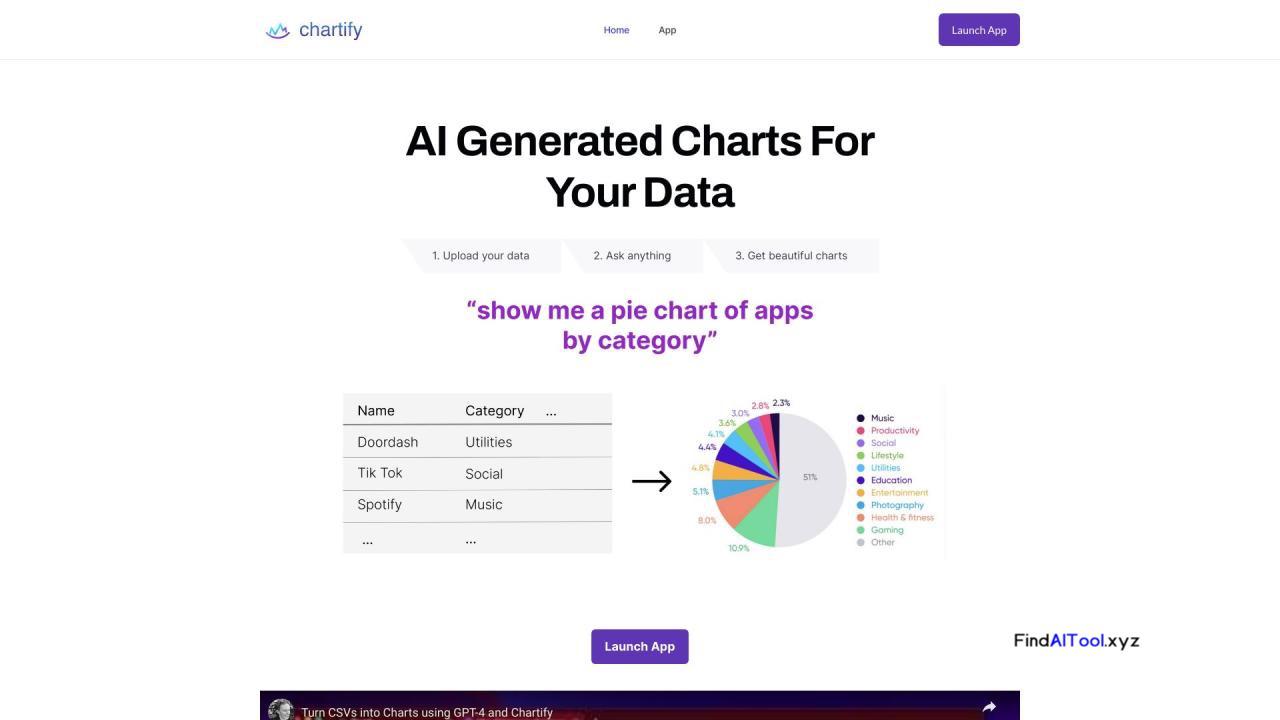
Chartify is an innovative AI-powered data visualization tool that transforms raw data from CSV files and database tables into engaging, interactive charts and graphs. This versatile software offers a seamless solution for users looking to create compelling visual representations of their data without extensive technical expertise.
At its core, Chartify leverages artificial intelligence to recommend optimal visualizations based on the input data, streamlining the process of chart creation. Users can also request specific chart types, providing flexibility and customization options. The software supports a wide range of visualization formats, including pie charts, line graphs, and bar charts, catering to diverse data presentation needs.
One of Chartify’s standout features is its integration with popular charting libraries such as Plotly, Matplotlib, Seaborn, and Charts.js, ensuring high-quality, professional-grade outputs. The intuitive interface allows users to easily upload CSV files or connect to Postgres and MySQL databases, making data import a breeze.
Chartify is particularly beneficial for professionals in data analysis, business intelligence, and reporting roles. It’s also an excellent tool for anyone involved in creating presentations or needing to visualize complex data sets. By simplifying the data visualization process, Chartify enables users to focus on deriving insights rather than grappling with chart creation technicalities.
This powerful tool brings significant value to its users by saving time, enhancing data comprehension, and facilitating better decision-making through clear, visually appealing representations of complex information. Whether for business analytics, academic research, or personal projects, Chartify offers a user-friendly yet powerful solution for turning raw data into meaningful visual stories.

