Elevate your stock analysis with Stockfeed.AI! Seamlessly integrate real-time news into Google charts. Make smarter trades, spot trends faster. Ready to revolutionize your investment strategy?
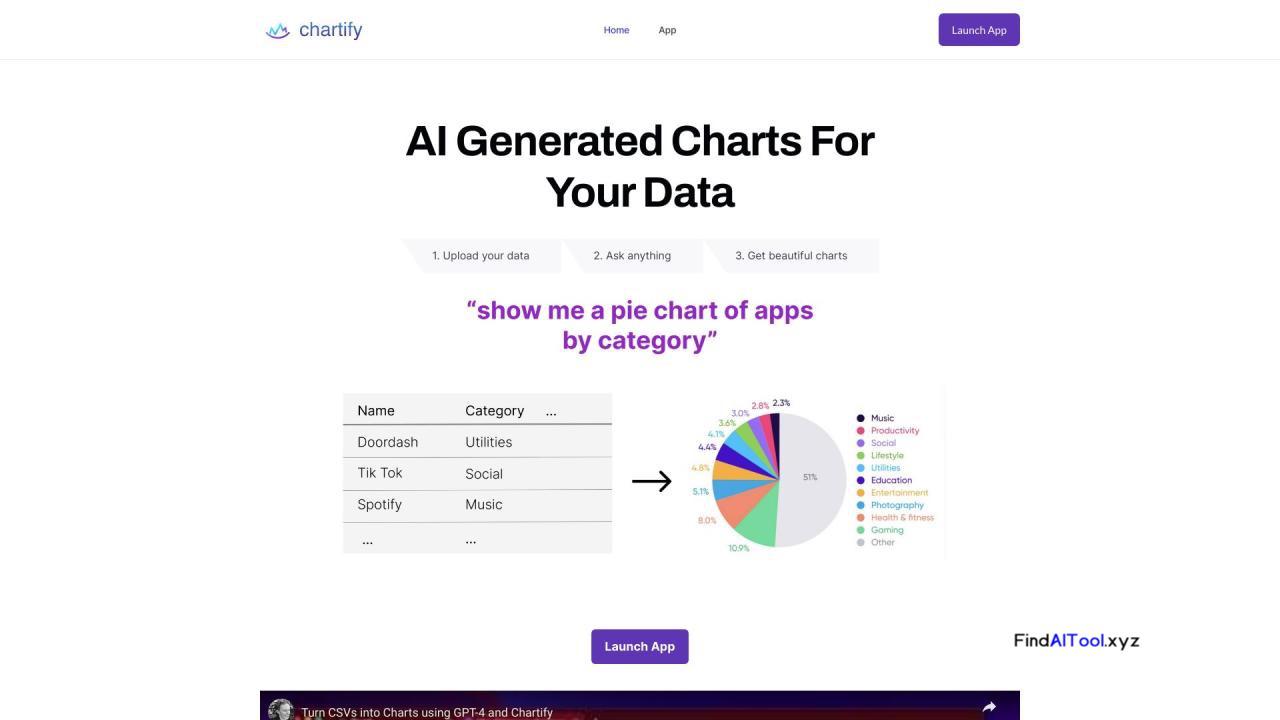
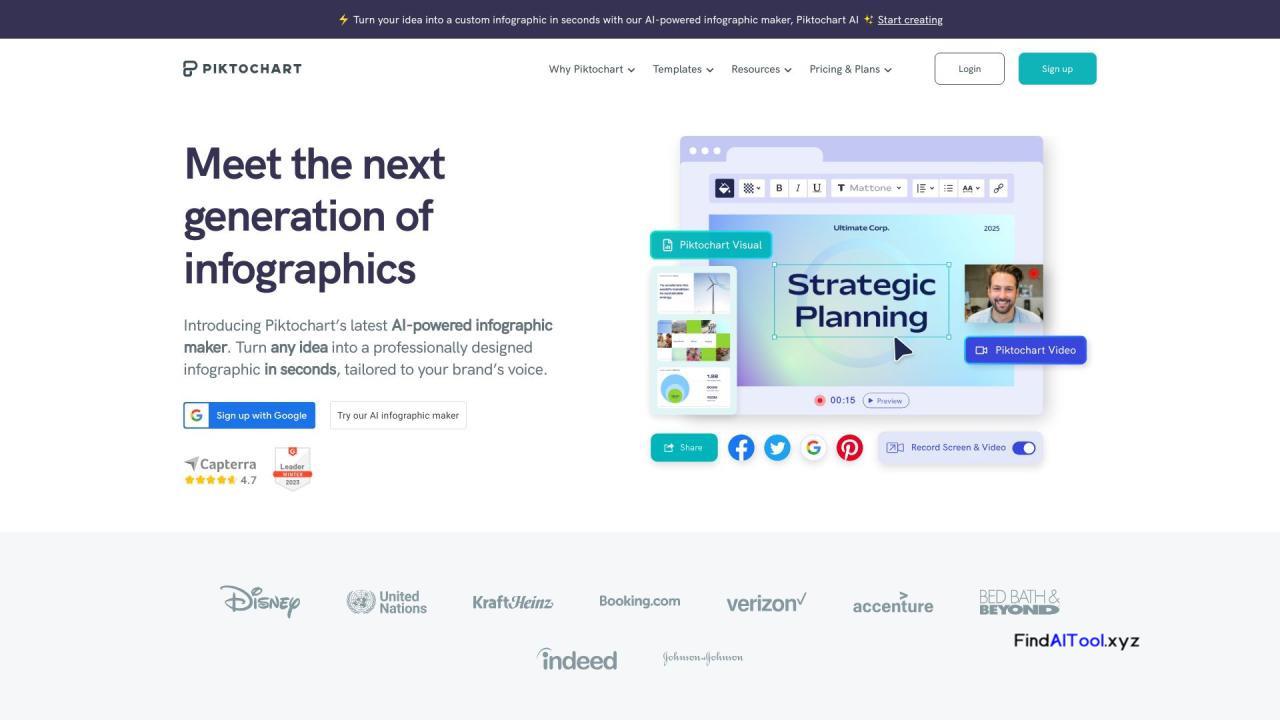
AI-powered chart creation tools revolutionize data visualization, enabling users to generate insightful graphs and diagrams effortlessly. These platforms leverage machine learning algorithms to analyze datasets and recommend optimal chart types, color schemes, and layouts. Notable examples include Tableau’s AI-driven features and Google Charts’ intelligent suggestions.
Key advantages include automated data interpretation, customizable templates, and real-time collaboration capabilities. These tools support various chart formats, from basic bar graphs to complex network diagrams, catering to diverse industry needs.
As data-driven decision-making becomes increasingly crucial, AI chart generators are evolving to offer more advanced predictive analytics and natural language processing features, promising even greater accessibility and insights for users across all sectors.

