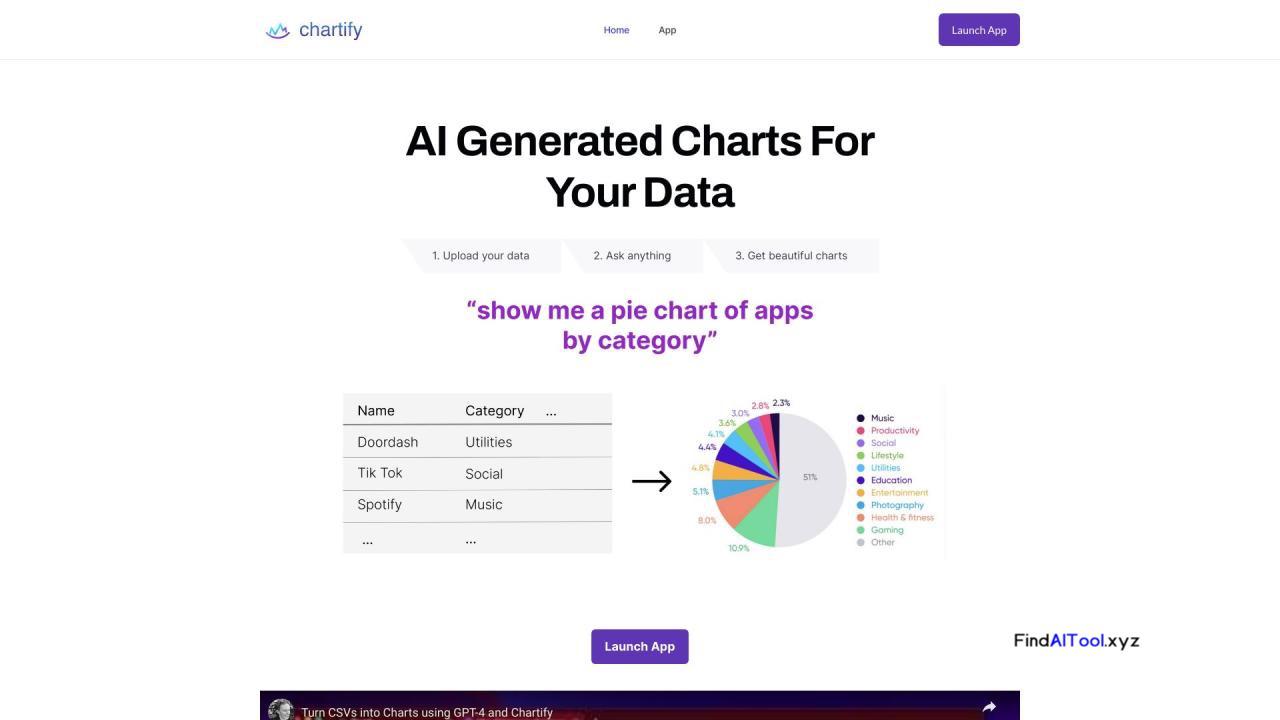
Transform your data into stunning visuals with Chartify! This AI-powered tool turns CSVs and tables into interactive charts. Discover insights effortlessly with AI-recommended visualizations. Ready to revolutionize your data game?
Uncover hidden insights with Dark Pools. Our AI-powered fraud detection and predictive analytics visualize customer journeys in real-time. Boost security and drive growth with cutting-edge ML algorithms.
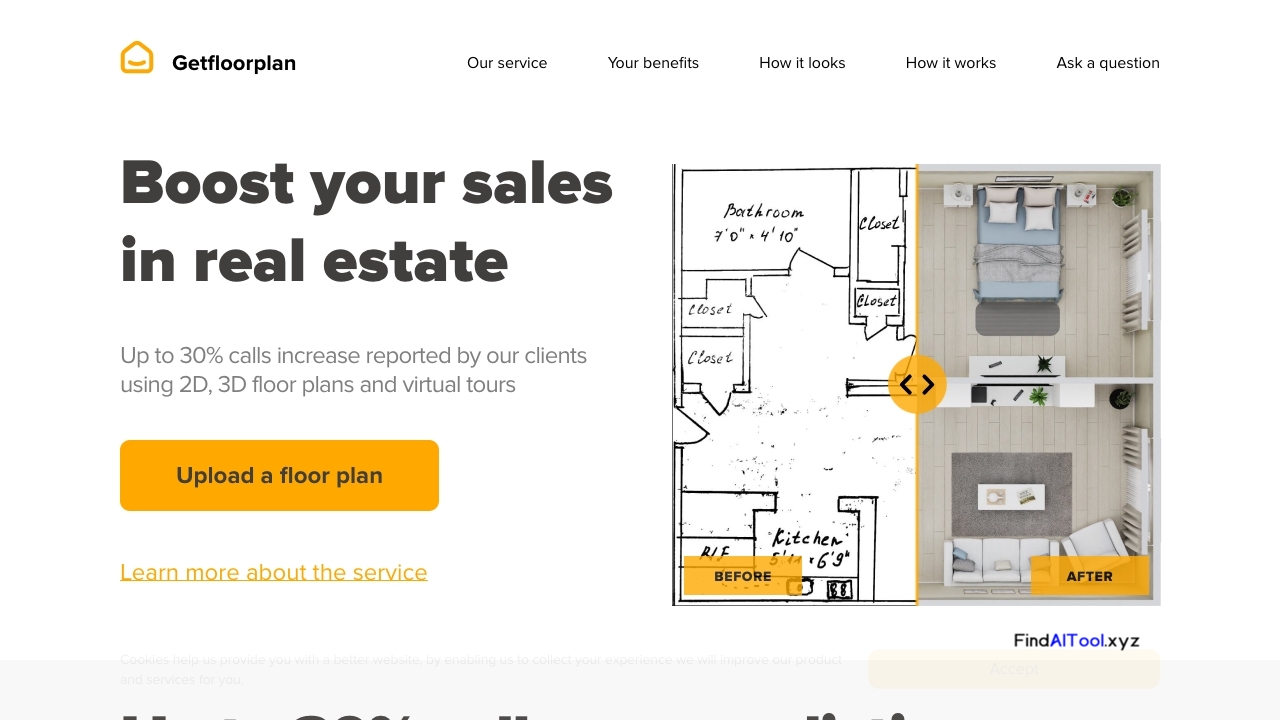
Transform property listings with Getfloorplan’s AI! Create stunning 2D/3D floor plans & 360° tours in minutes. Boost buyer interest by 40%+. Ready to revolutionize your real estate visuals?
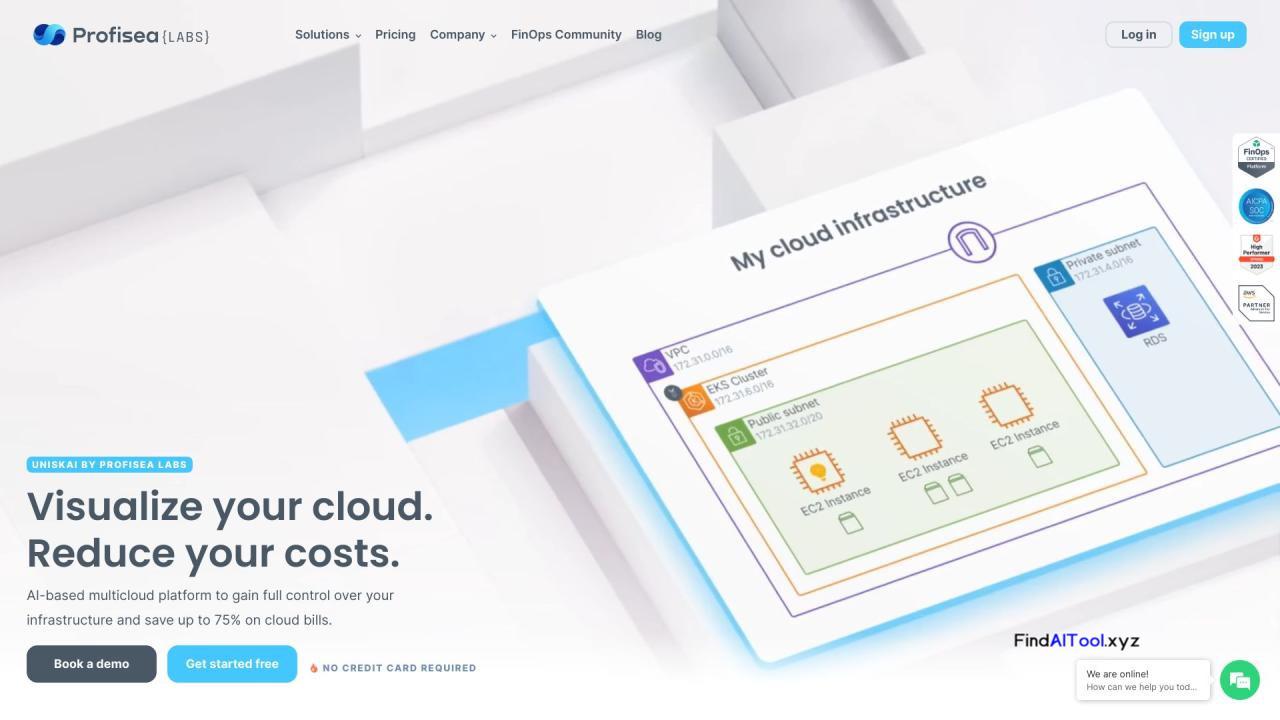
Slash cloud costs by 70% with Uniskai’s AI-powered platform. Gain full control, visualize spending, and optimize your multicloud infrastructure. Ready to transform your cloud strategy?
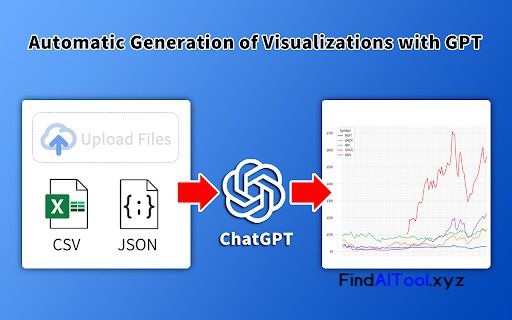
A tool for generating data visualizations and data-faithful infographics using state-of-the-art LLMs.
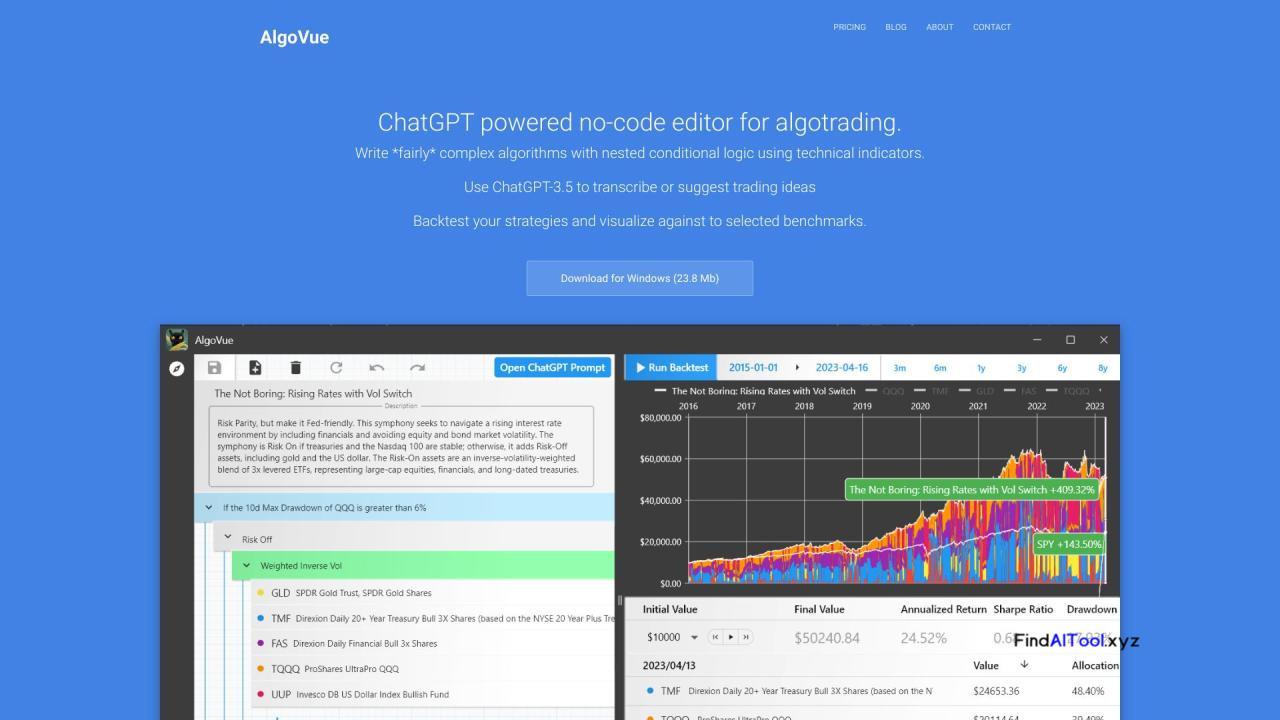
AlgoVue is a no-code editor for algo trading that allows users to create fairly complex algorithms with nested conditional logic using technical indicators. It integrates ChatGPT-3.5 for transcribing or suggesting trading ideas, and offers backtesting and visualization capabilities against selected benchmarks.
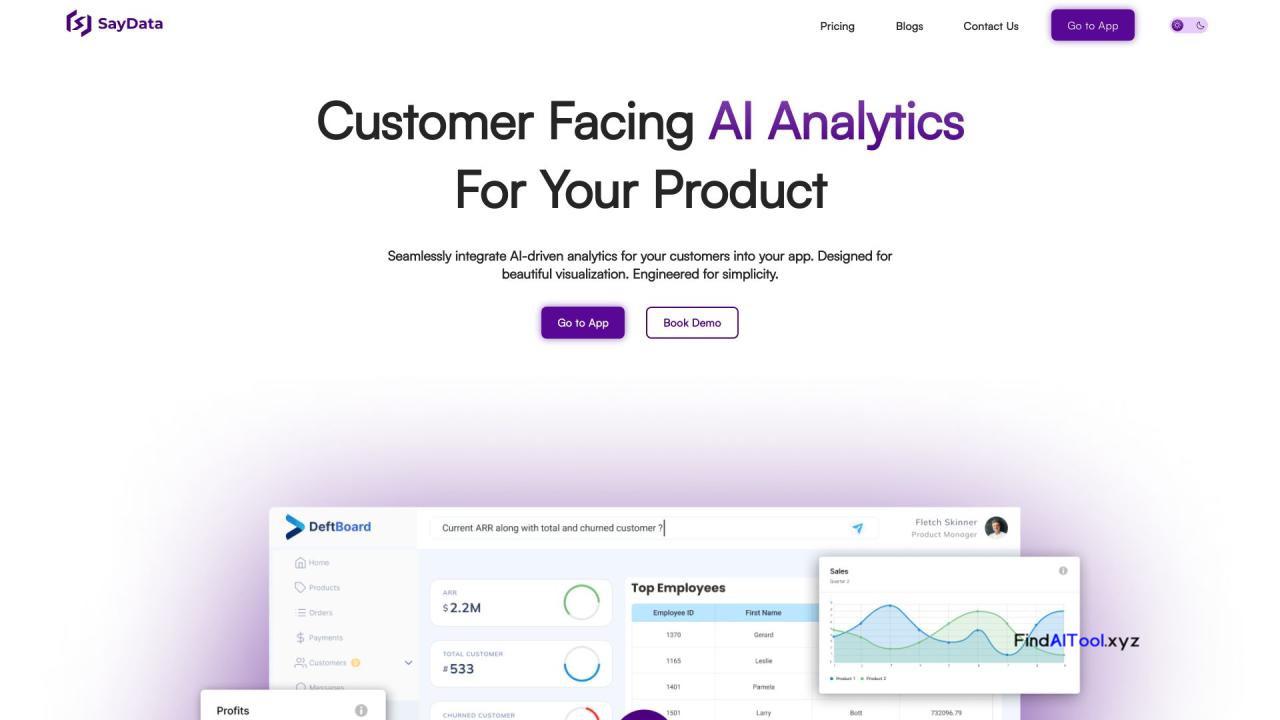
SayData is a customer-facing analytics platform designed specifically for SaaS platforms. It seamlessly integrates AI-driven analytics into your app, providing beautiful visualizations and simplicity for your customers.
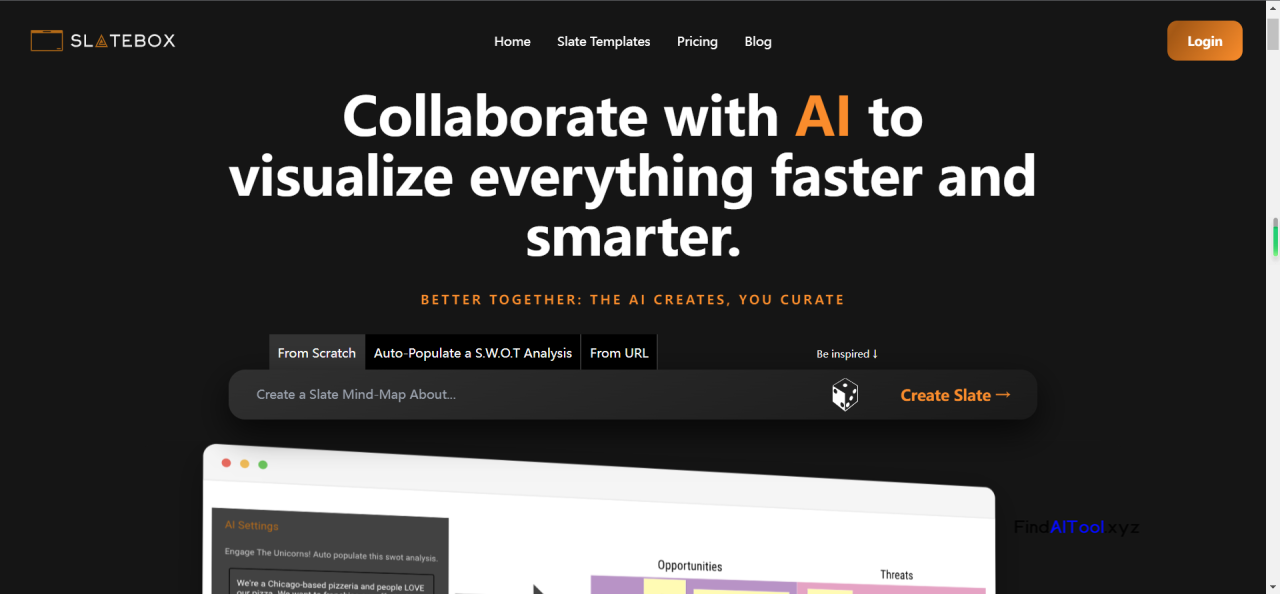
Slatebox is a visual collaboration platform with AI superpowers that allows users to create editable visualizations from natural language prompts. It offers a range of templates and features to facilitate real-time collaboration and integration with other tools.
Channel is a data analytics platform that allows users to ask questions in plain English and get answers from their connected databases. It offers self-serve data insights without the need for SQL knowledge and generates beautiful visualizations for data analysis.
Visualization AI tools transform complex data into intuitive visual representations, enabling deeper insights and clearer communication. These powerful solutions leverage advanced algorithms to create interactive charts, graphs, and dashboards. Tools like Tableau and D3.js excel in data exploration and storytelling, while platforms such as Power BI offer robust business intelligence capabilities. From predictive analytics visualizations to real-time data streaming, these tools cater to diverse industries including finance, healthcare, and marketing. As AI continues to evolve, visualization tools are incorporating more sophisticated features like natural language processing for query-based visualizations and augmented analytics for automated insight generation. The future of data visualization promises even more immersive and accessible ways to unlock the power of information.